
This post is from a recent project I have been working on, which required a substantial amount of original data processing and cleaning. Along the way, I encountered several interesting findings that I decided to share.
As my project analyzes the causal impact of crime news on their perceptions, I was forced to process tons of broadcast news transcripts. Because I needed biased news sources from both sides of the political spectrum, following Kim et al. (2022), I have chosen the big three: Fox News, CNN, and MSNBC.
The main goal of the project was to identify transcripts discussing mundane, street-level crime, as this type of crime is most relevant for safety perceptions and subsequent economic activity within neighborhoods. Nevertheless, during the text cleaning process (and while reading a vast amount of crime news, something I would not wish on my worst enemy), I encountered several interesting patterns.
How exactly did I end up reading crime news during my evenings?
After downloading the transcripts, I had to study the data in minuscule detail. Even after extensive cleaning, I was left with around 100,000 transcripts across all three networks. At that point, I needed to determine which transcripts actually discussed street-level crime. Since it was clearly impossible to study each transcript manually, I turned to machine learning classifiers.
To ensure precision and account for linguistic differences across networks, I trained separate classifiers for each network. Nevertheless, that required reading a substantial portion of the transcripts so I could manually label training data into the so-called ‘street crime’ category and familiarize myself with how each network reports crime firsthand.
In total, I ended up reading 900 crime-related transcripts for each network, making it 2,700 in total. After reading the first 100 CNN transcripts, I noticed that many topics overlapped. So I decided to expand my classification beyond street-level crime to include additional recurring topics observed. I then repeated the same process for Fox News. However, it quickly became clear that these topics differed substantially across networks.
This raised a natural question: which news broadcasts, if any, resemble actual crime patterns in their reporting?
Why does it matter?
This is a question I have been asking myself since I started to manually classify these transcripts. At times, the only thought in my mind was: What business does have trained economist have doing this? The answer, ultimately, is curiosity.
Even though I have been working with crime statistics for quite some time, and I consider myself to have a better understanding of it than most, my own perception of crime does not stem solely from them. Instead, it can be shaped by personal experience, stories from others, and media reporting (in more technical terms, one can think about this in terms of an updating mechanism). The same is even more true for the rest of the population, the majority of whom do not have access to big data or a strong understanding of statistics. As a result, news networks can meaningfully shape perceptions, especially since most crime is not directly observed by individuals and thus cannot easily be used to form representative beliefs or perceived likelihoods.
So, does crime reporting by news networks even remotely reflect actual crime patterns? This week, I analyze Fox News.
Brief Methodological Note (only for the most interested)
I collected broadcast news transcripts from Nexis Uni for three major cable networks (Fox News, CNN, MSNBC). My sample covered the period from 2008 and 2024 and included either the word “crime” or a broad set of “crime-related” keywords (and excluded “crime”). Because crime-related keywords are often used metaphorically, especially the use of“crime-related” keywords, this brings noise into the dataset, bringing the need for machine text classification.
I cleaned the dataset by removing formal elements (e.g., reporter names, timestamps), excluded non-cable sources (e.g., CNN.com), Spanish-language transcripts, and international news from the data. Finally, in each transcript, I keep only sentences that contain a keyword, along with the immediately preceding and following sentences, so I get the strictly crime-related part of the transcript.
For classification, I manually labeled 900 transcripts per network (2,700 in total), covering multiple crime-related categories that were chosen after an initial reading of 100 transcripts for each network. Categories are non-exclusive, and transcripts could belong to more than one category. I then used these labels to train and validate several text-classification models, including logistic regression, random forests, a convolutional neural network, and a BERT-style model.
Classification was performed separately for each network to account for differences in language and political framing. Across most topics, random forest models with TF-IDF features performed best and were therefore used for the final topic classification.
For a more detailed explanation of the methodology and the code, visit my GitHub page.
Case of Fox News
Let’s check what official data has to say first.
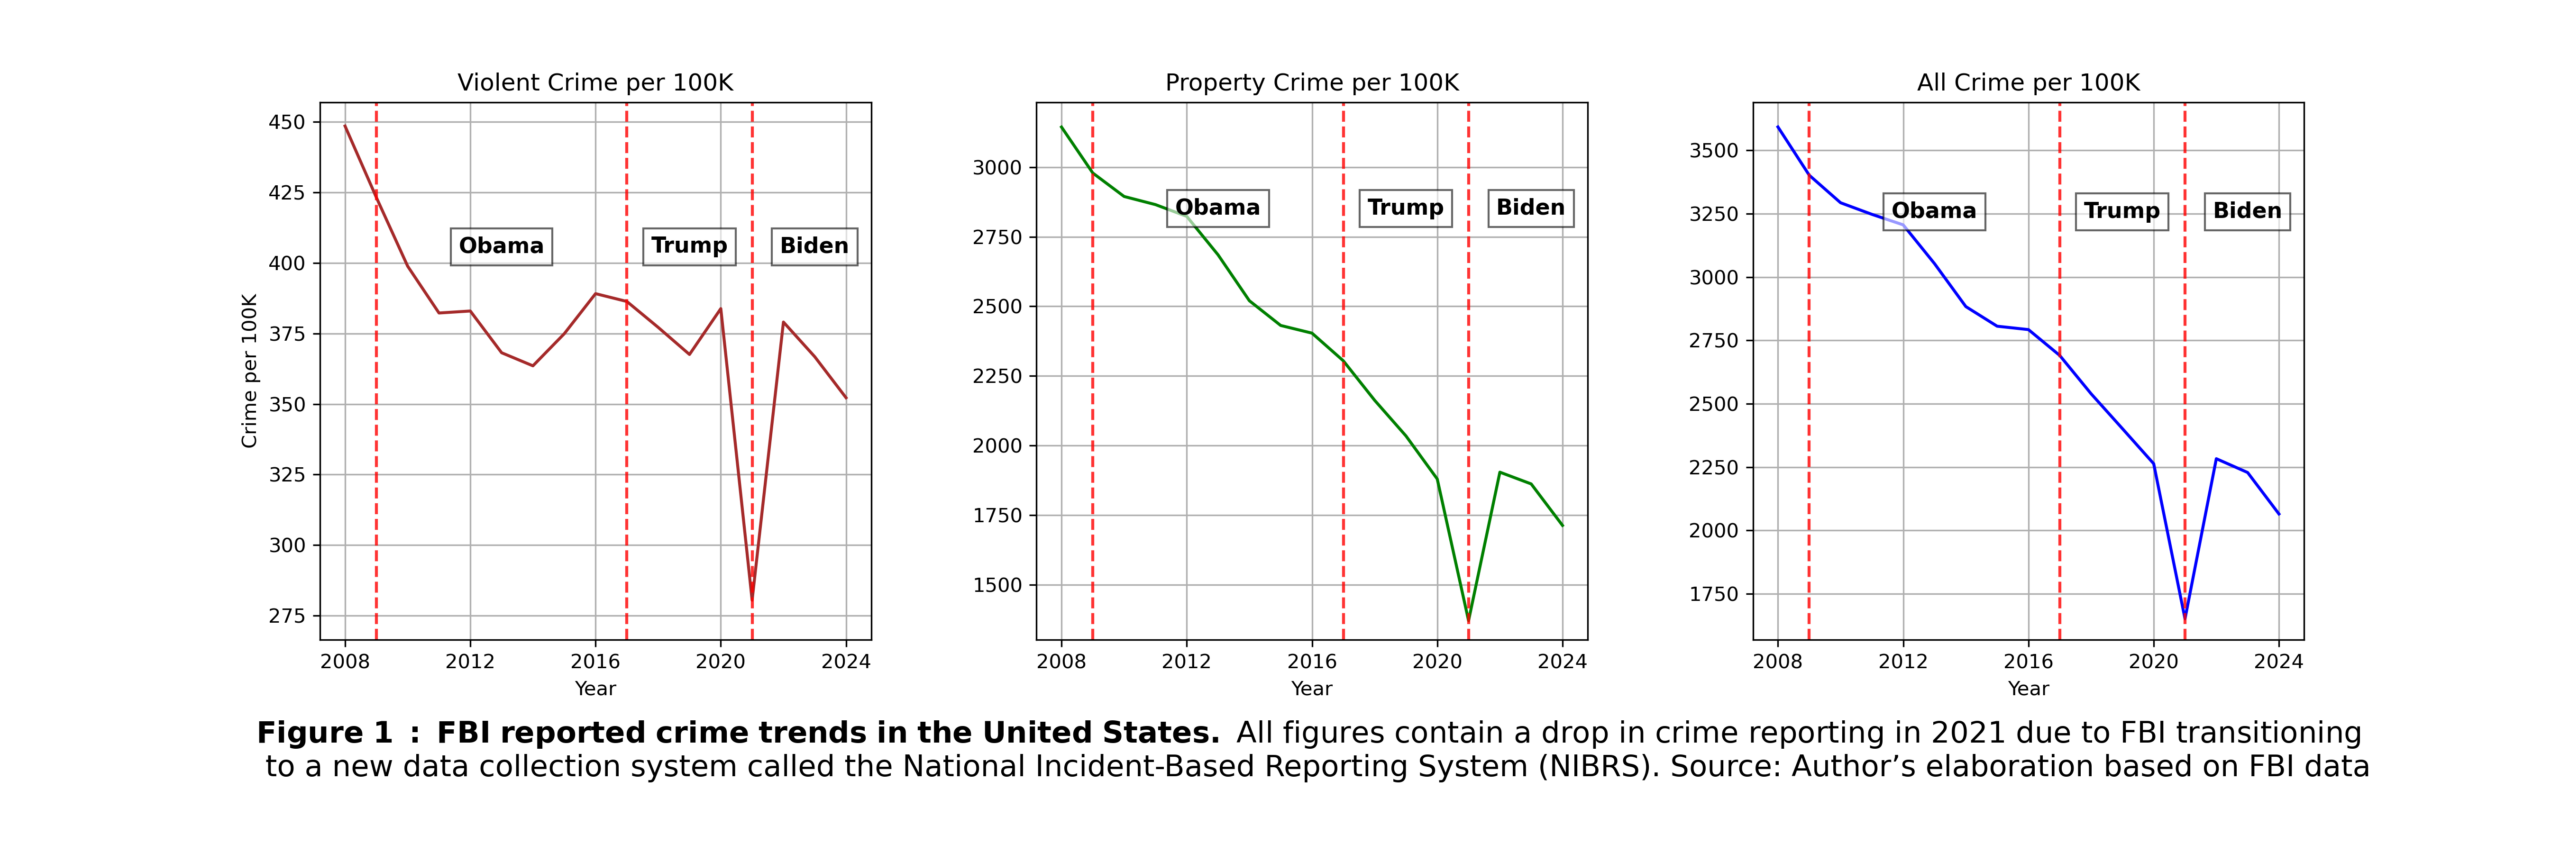
As can be seen from the FBI data I collected, reported crime (per 100k) declined from the early 2000s onward, with some ups and downs in violent crime starting around 2014 (I beg your pardon for the FBI 2021 underreporting issue).
Now, for the crime reported, I have chosen only the 10 most commonly appearing topics and further discarded two of those with the least accurate classification. Categories are not exclusive, meaning that one story can be about immigration and riots at the same time. Individual categories might not necessarily overlap with ‘street-level’ crime per se. That will be the focus of the next section. The graphs show the number of stories during each year.
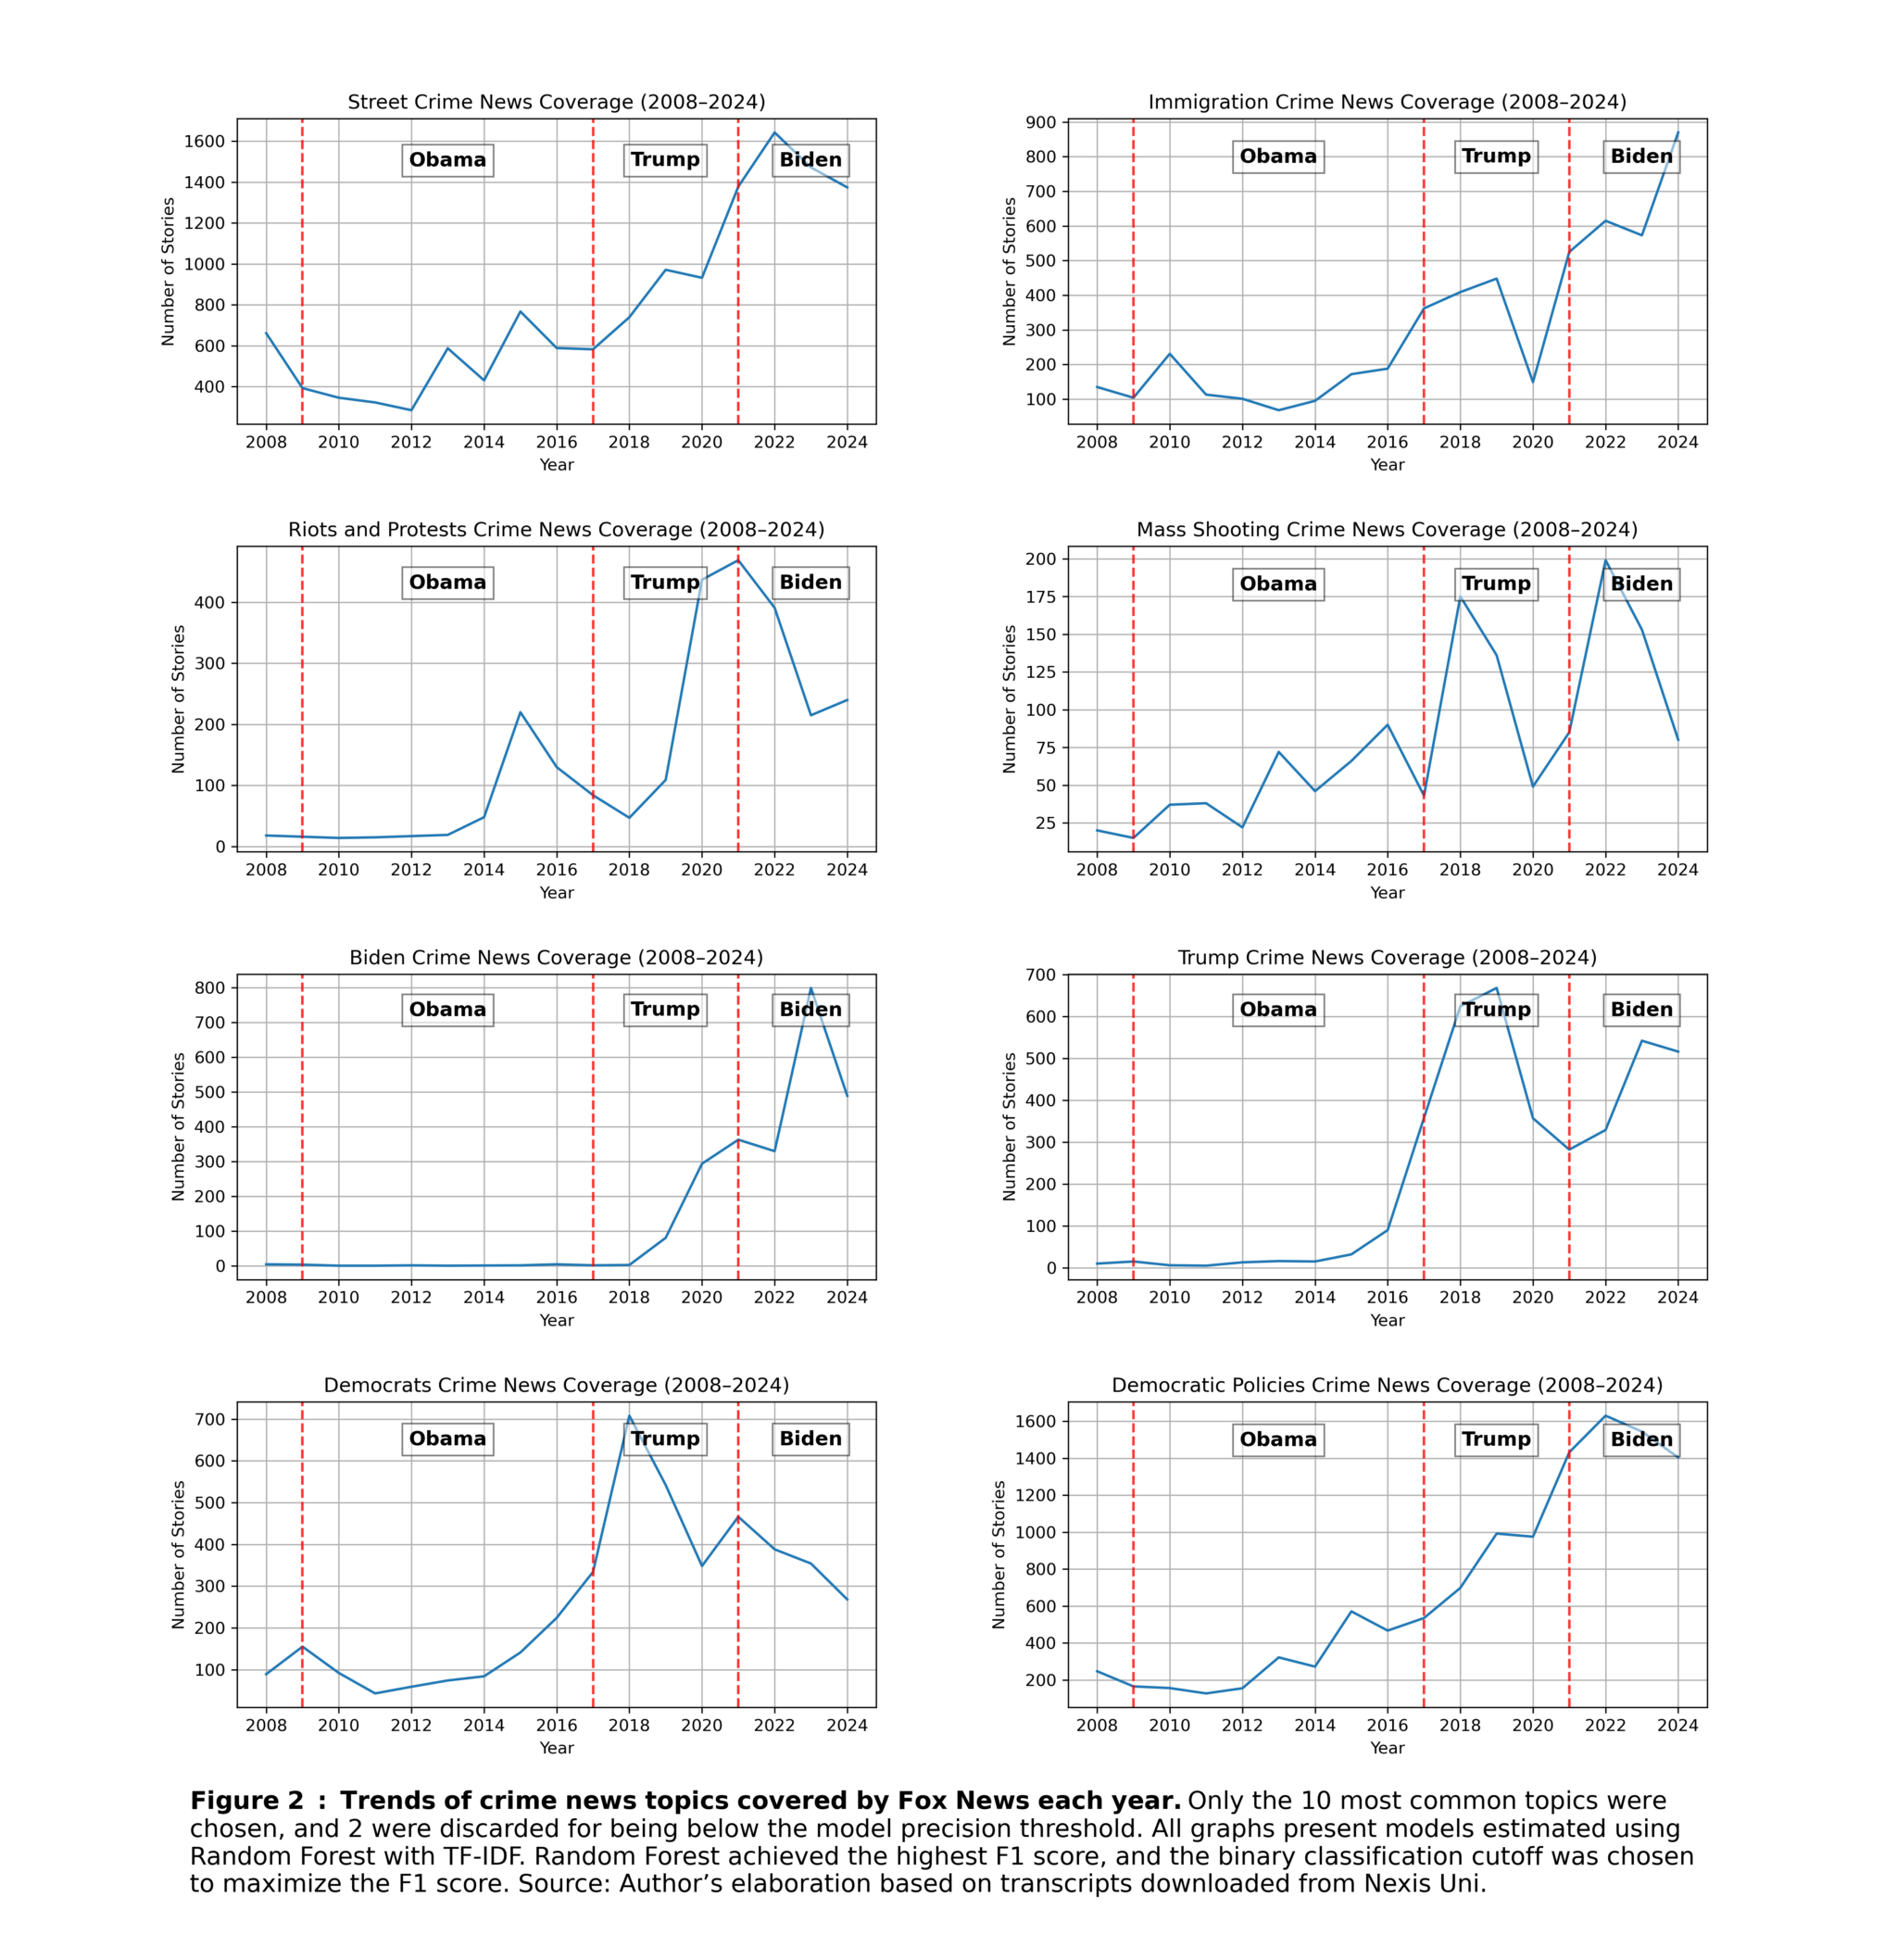
As shown in the graph in the upper-left corner, there is little resemblance between crime reporting on Fox News and FBI crime statistics. If anything, the trends appear to move in opposite directions. One can certainly argue that national reporting focuses on more serious crime; however, neither reported violent crime do not closely tracks the FOX reporting.
Let’s analyze immigration, riots and protests, and mass shooting transcripts. Immigration-related stories increased substantially over time, and are somehow loosely mirroring monthly encounters of illegal migrants at the southwest border. Stories about riots and protests and mass shootings also show a closer resemblance to real-world events. Riot-related coverage peaks around the Ferguson protests (2014) and the George Floyd protests (2020), while mass shooting coverage largely aligns with actual incidents.
Political stories related to crime appeared to be very common. First, stories involving Presidents Trump and Biden were especially frequent, naturally peaking during their respective administrations (and, in the case of President Trump, also around his 2023 criminal indictment). A substantial number of stories also focused on crimes committed by members of the Democratic Party, particularly during Trump’s first term (e.g., the Hillary Clinton email controversy). Nevertheless, these categories may be driven less by the sheer number of crimes committed and more by the prominence of major political controversies.
One particularly striking category, and the most prevalent one, is criticism of Democratic or liberal policies. This category increased sharply starting around 2008 and reached much higher levels than any other crime-related topic. To clarify, this category includes, for instance, stories arguing that liberal cities or specific district attorneys are responsible for crime in their constituencies or those doing so on the federal level (related, for example, to immigration crime).
What is the overlap of these stories in actual street-level crime?
The previous graphs do not tell the full story. While examining individual categories is informative, the key question is how these topics are represented within crime reporting overall. Stories about, for example, Hunter Biden do not meaningfully affect how people perceive crime in their own neighborhoods, and are unlikely to directly influence local economic activity or migration patterns.
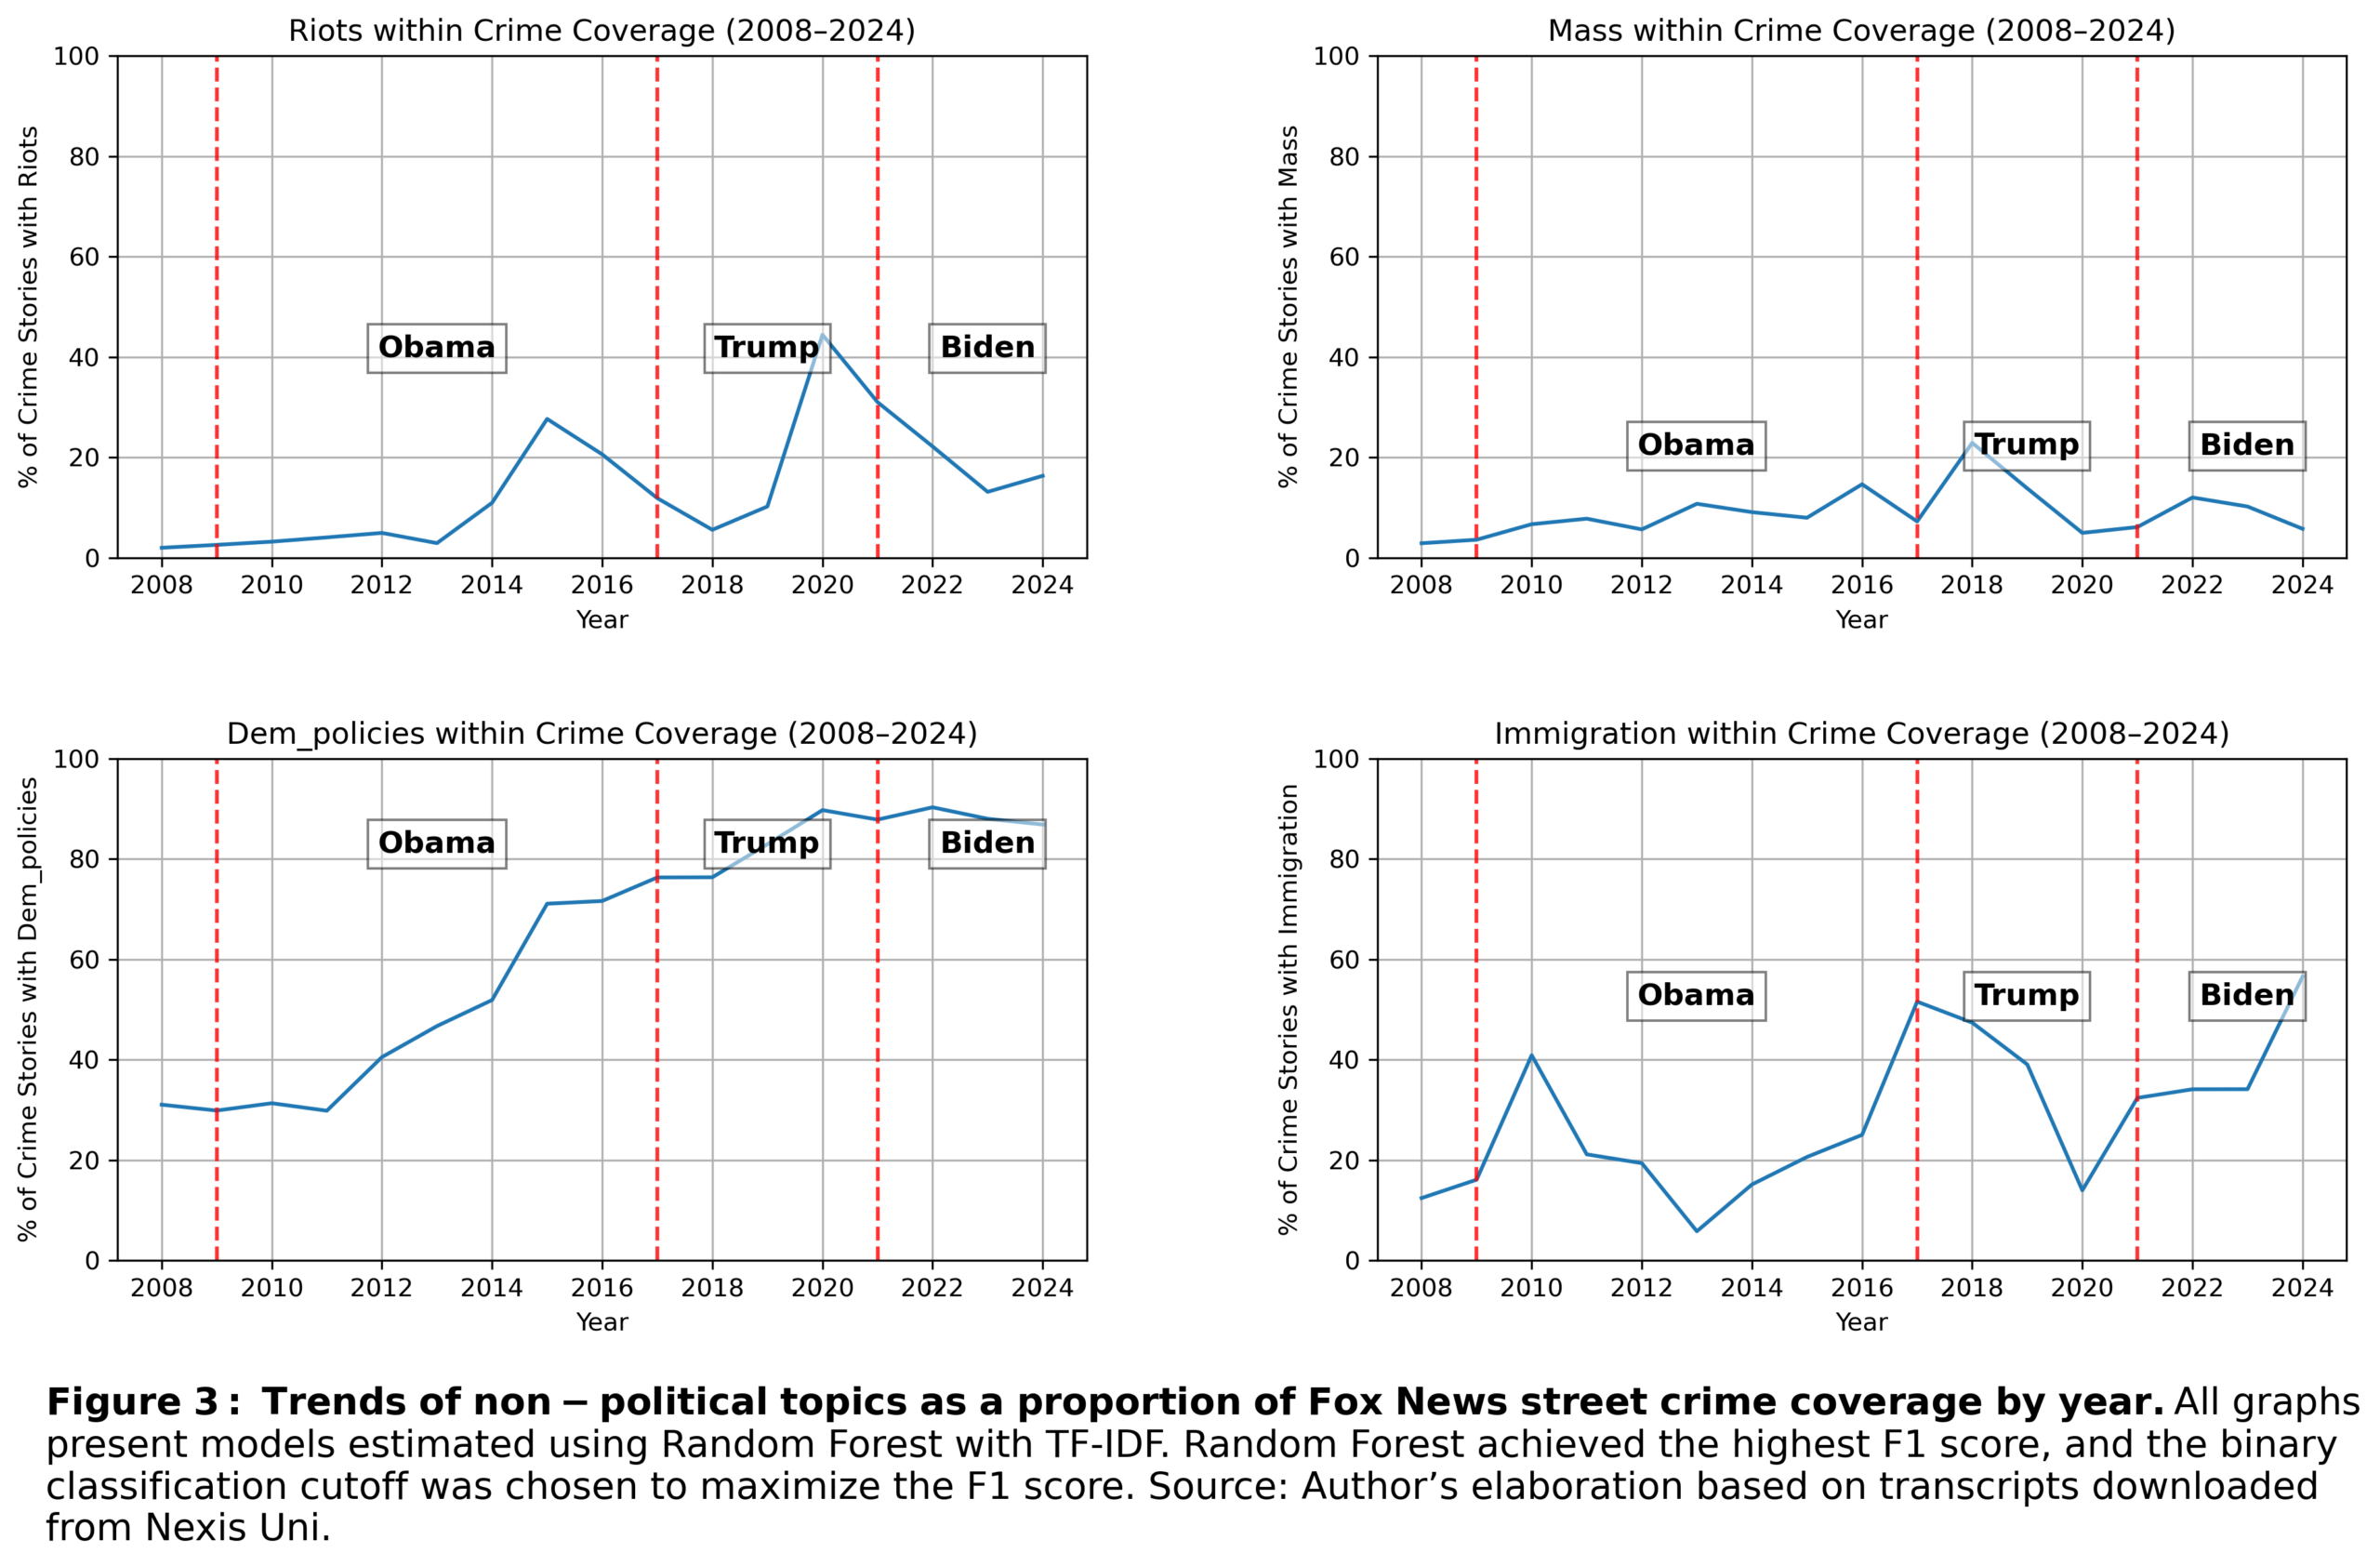
When looking at proportions, the picture becomes clearer. Peaks remain visible for certain topics, such as riots in 2020 or immigration in 2017 and 2024, with these topics accounting for roughly half of all crime-related stories at times. Even though this is a substantial proportion, there is another category that clearly dominates the reports. Criticism of Democratic or liberal policies is the dominant driver of crime reporting on Fox News. In other words, political commentary appears to drive increases in crime coverage more than crime itself.
What if I exclude politics from crime reporting?
After seeing the conclusion of the previous section, I started to ask myself the obvious. Can we still observe an increase in crime reporting after excluding political content? As the next graph shows, the answer is yes, but.….
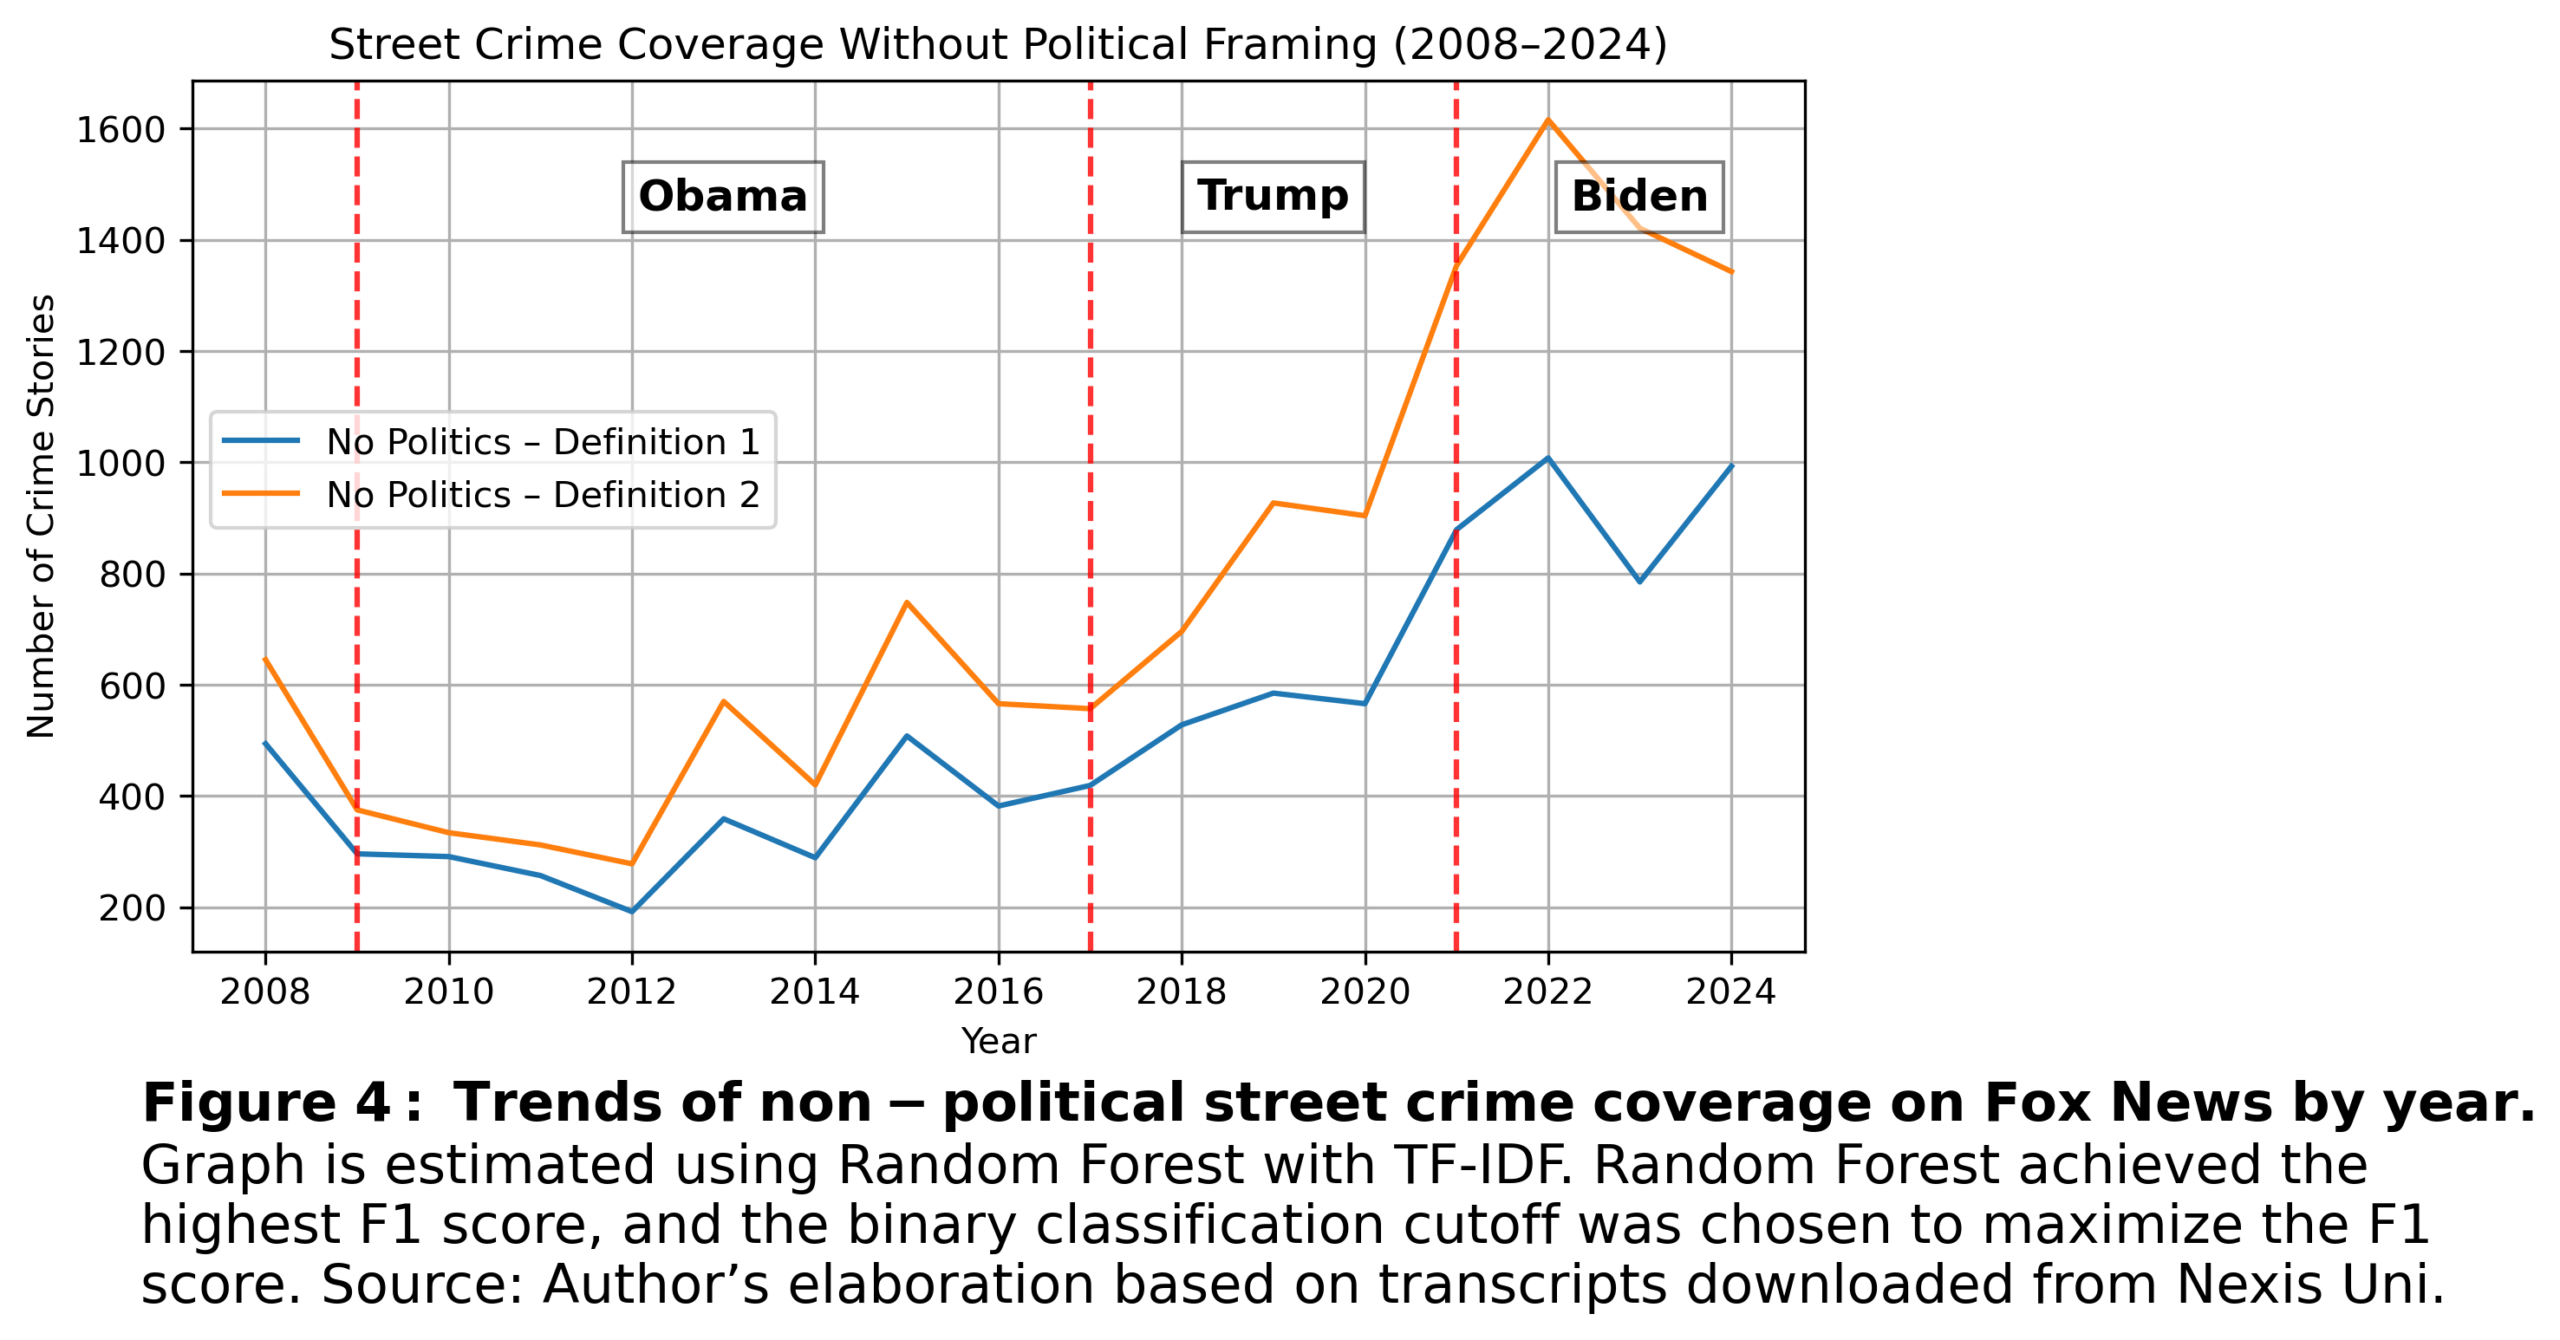
The magnitude of the increase varies depending on the definition used. Under Definition 1, I classify a story as crime-related only if it excludes stories that exclusively discuss “Trump,” “Biden,” or crimes involving Democrats (“Democrat Crime”). Under Definition 2, I further exclude stories that primarily criticize liberal policies (“Democratic Policies”). Both definitions are valid. Critiques of liberal policies often reference very real crime events, but these events are embedded in political commentary. In other words, the crime itself is real, but the emphasis is placed on criticizing the policies associated with it.
We see that crime stories that include political commentary substantially push reporting upward. On the other hand, if these stories are excluded (and assuming accurate FBI crime reporting for 2021), the peaks in reported crime and FBI crime statistics would appear much more similar.
So, is crime reporting proportional to reality?
Proportional to actual crime? Not really. Nevertheless, for many non-political crime categories, reporting may still track true crime peaks reasonably well. Political commentary and criticism of liberal policies, however, can clearly distort the overall picture.