
My recent project required analyzing biased crime broadcasts. Based on the existing literature, I focused on the “big three” cable networks: Fox News, CNN, and MSNBC. Last time, I examined Fox News; this time, I took a sharp turn left and focused on MSNBC.
The primary goal of the project was to identify transcripts discussing mundane, street-level crime, so I had to review numerous crime-related news transcripts and filter out the relevant ones. I ended up with a large number of transcripts that I was unable to read (around 100K), so I decided to find comfort in machine learning techniques.
I wanted to train my own models, but before that, I was forced to work as a human classifier (a truly painful experience), which made me see firsthand what big networks air on cable. I guess one perceives reading words more seriously, as the mind has more time to digest the content than when passively listening to crime news. Just imagine cooking lasagna for Saturday lunch and, in the background, superficially listening to commentary about the current crime situation from your news source.
This process made me realize that the content aired on each network has distinct characteristics. As this pattern became clearer, I decided to expand my classification into additional categories and broaden my models to classify the topics that repeat most often on each network.
Brief Methodological Note (only for the most interested)
I collected broadcast news transcripts from Nexis Uni for three major cable networks (Fox News, CNN, and MSNBC). My sample covered the period from 2008 to 2024 and included transcripts that contained either the word “crime” or a broad set of “crime-related” keywords (and excluded the word “crime”). Because crime-related keywords are often used metaphorically, this brings noise into the dataset and urges the need for machine text classification.
I cleaned the dataset by removing formal elements (e.g., reporter names, timestamps), excluding non-cable sources (e.g., CNN.com), Spanish-language transcripts, and international news from the data. Finally, in each transcript, I kept only sentences that contained a keyword, along with the immediately preceding and following sentences, so I obtained the strictly crime-related part of each transcript.
For classification, I manually labeled 900 transcripts per network (2,700 in total), covering multiple crime-related categories chosen after an initial reading of 100 transcripts for each network. Categories were non-exclusive, and transcripts could belong to more than one category. I then used these labels to train and validate several text-classification models, including logistic regression, random forests, a convolutional neural network, and a BERT-style model. Classification was performed separately for each network to account for differences in language and political framing. Each model produced the probability that a transcript contained the chosen categories.
To choose an appropriate cutoff point for the final binary classification, I selected the value that maximized the F1 score for each model. Therefore, each model had a different cutoff point according to its own maximization procedure.
Across most topics, random forest models with TF-IDF features performed best and were therefore used for the final topic classification. By “best,” I mean that the F1 score of the model was the highest across all models. For a more detailed explanation of the methodology and the code, visit my GitHub page.
Case of MSNBC
As in my previous post, it is helpful to peek at the FBI crime reports first. Again, let’s keep in mind the underreporting in 2021.
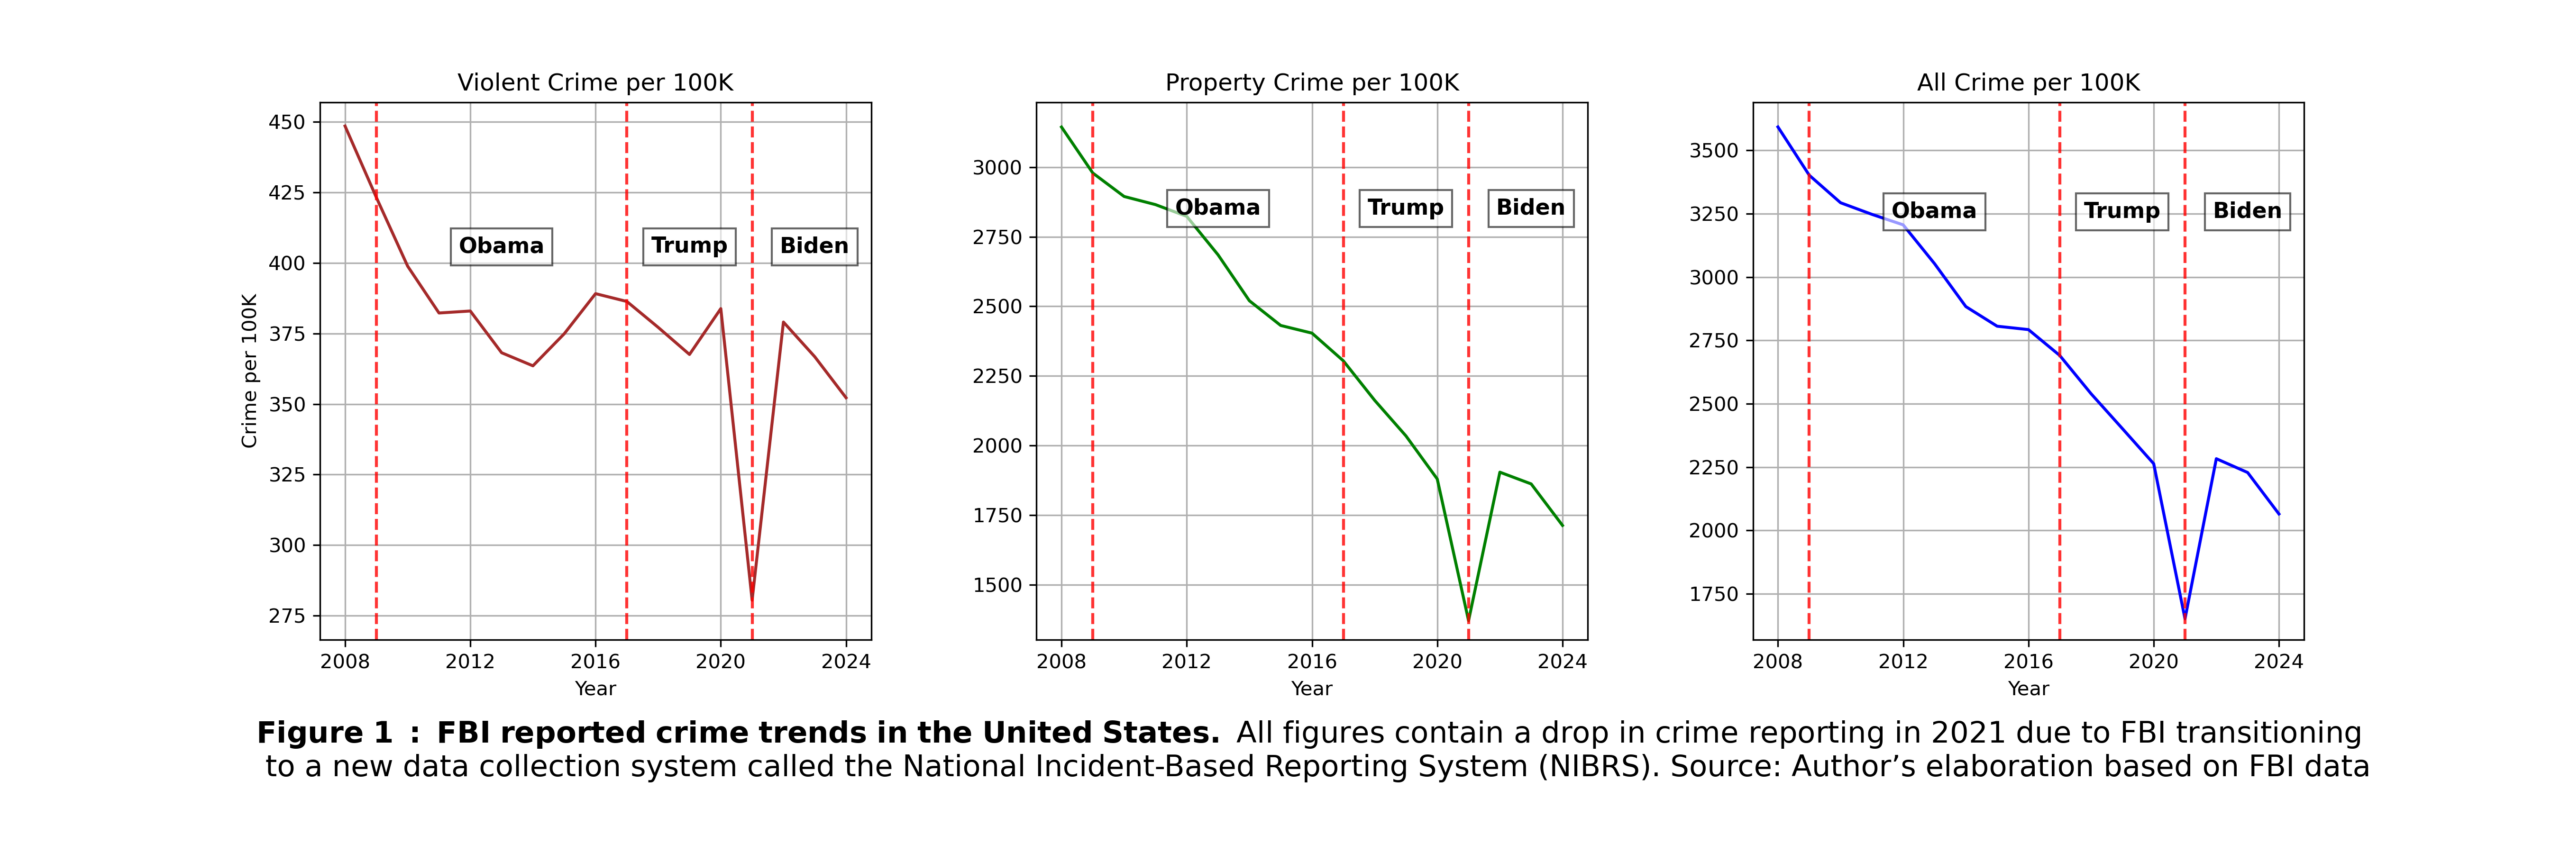
As can be seen from the FBI data I collected, reported crime declined from 2008 onward, with some fluctuations in violent crime starting around 2014.
The most common crime-related topics aired on MSNBC can be seen in Figure 2.
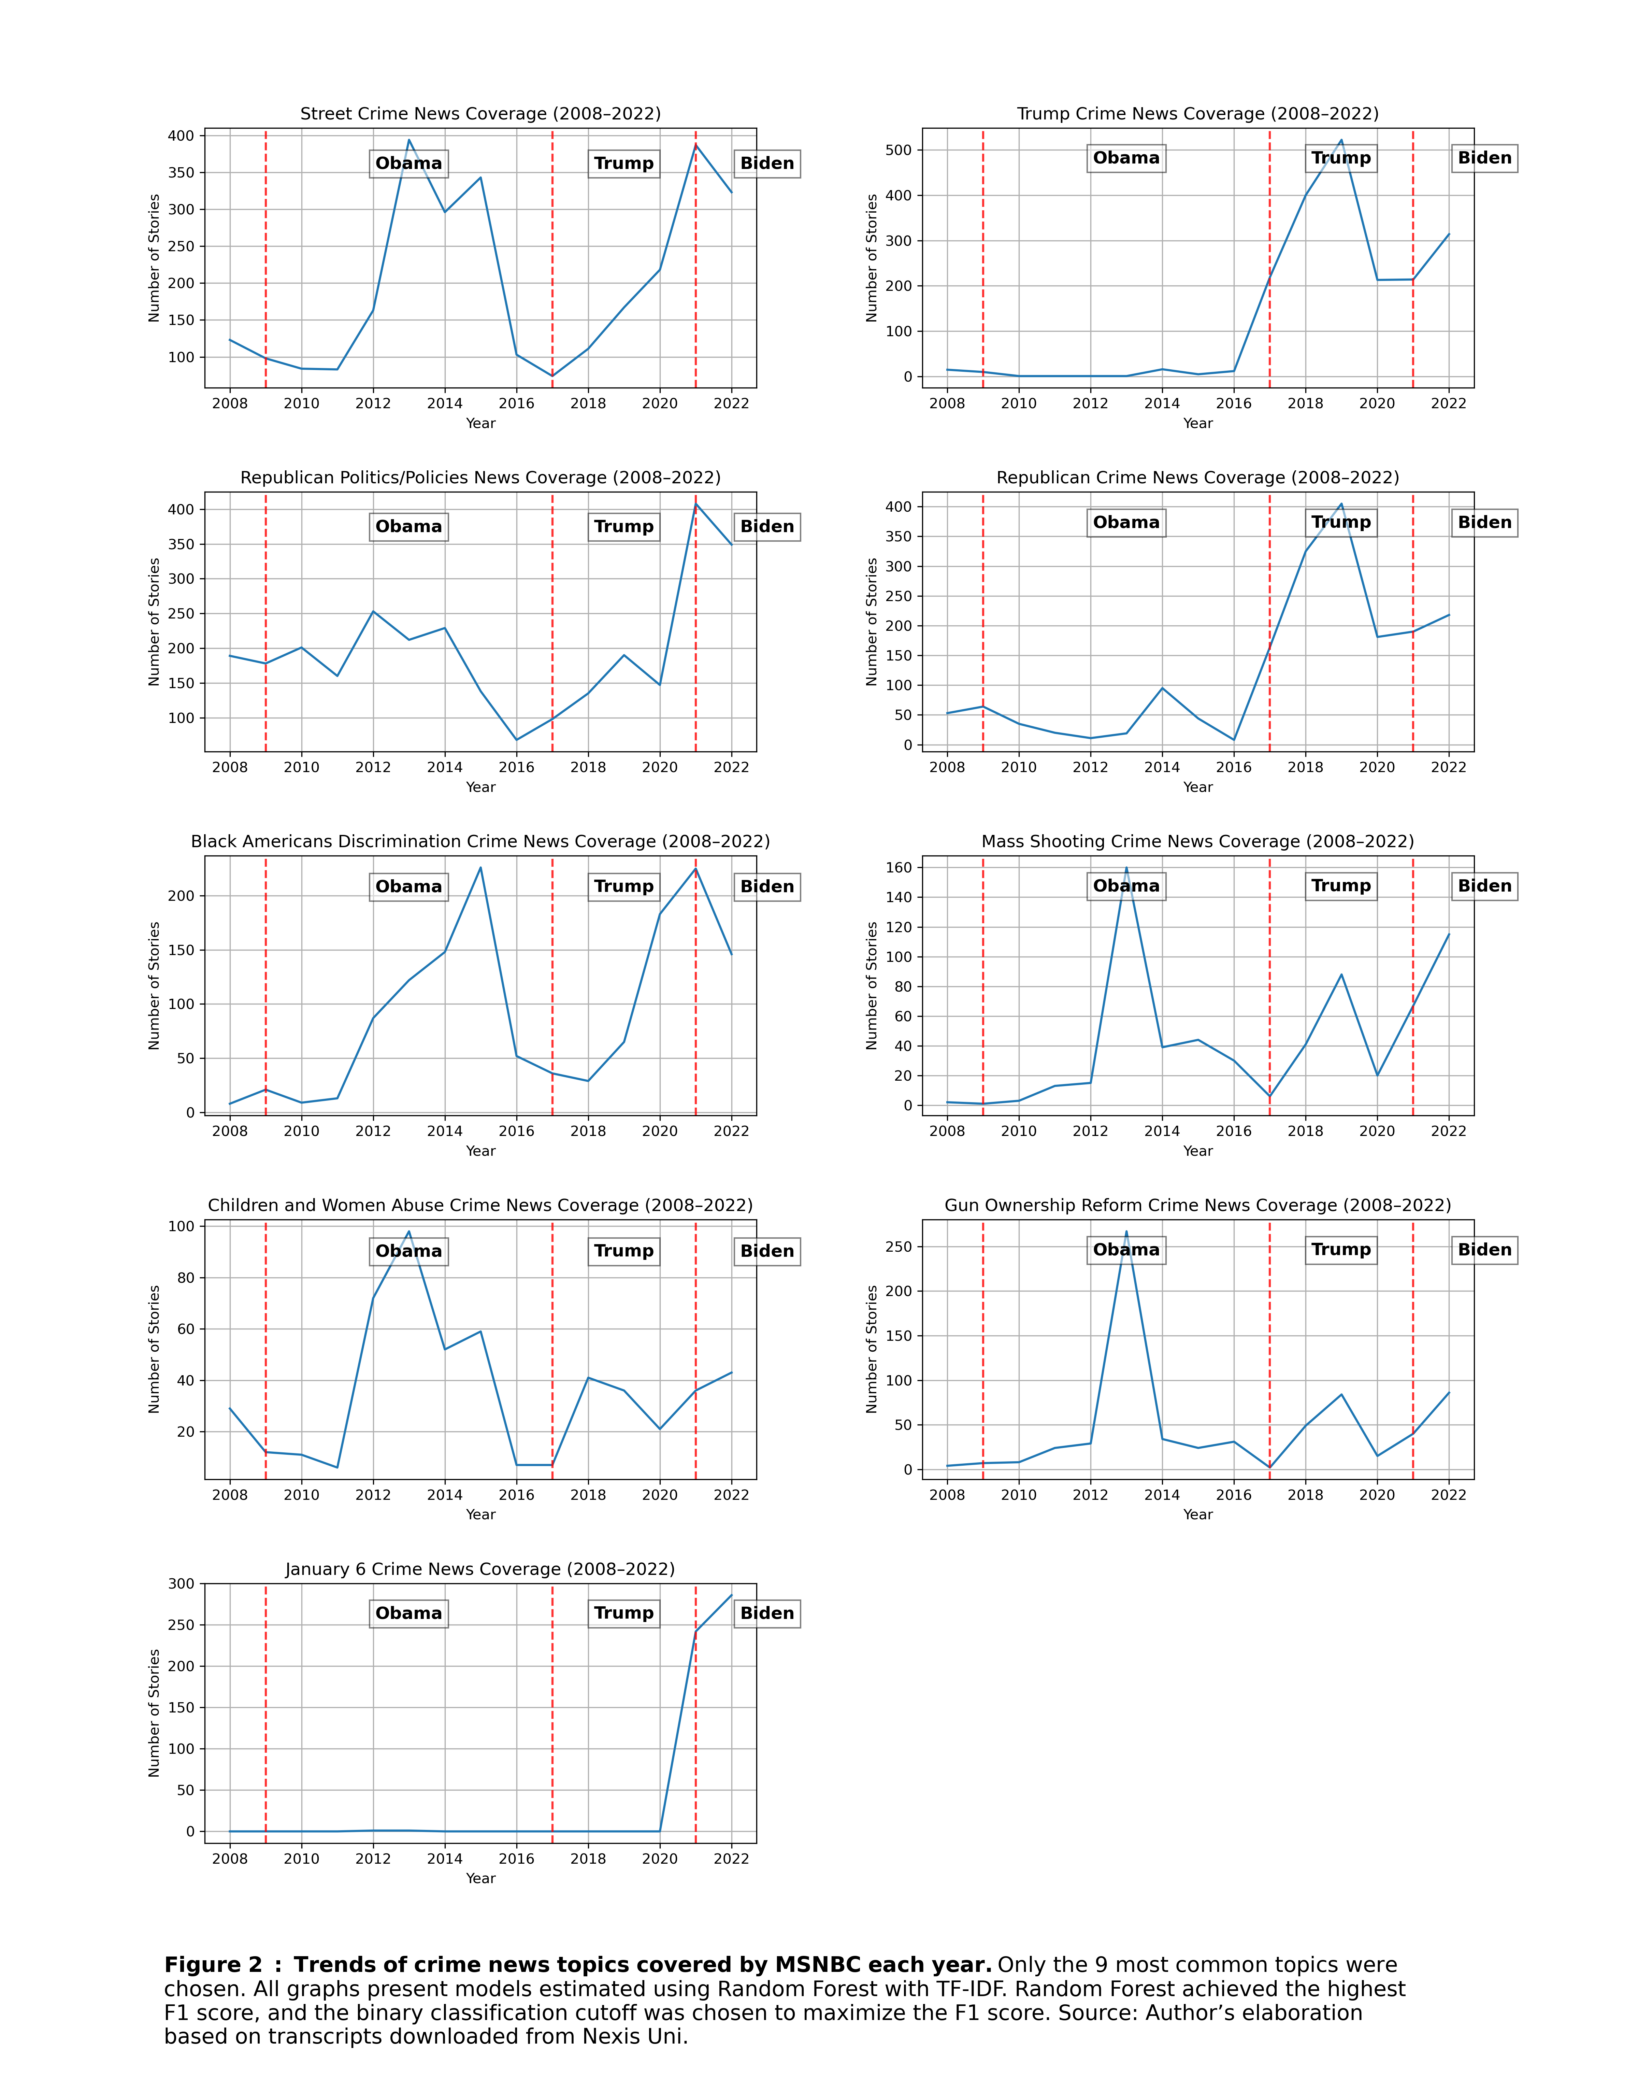
First and foremost, MSNBC had considerably less crime content than CNN and Fox News. Also, much of the crime-related content seems to be in the form of commentary rather than specific crime occurrences.
In general, street crime news does not seem to follow the FBI data trend. Overall crime, according to the FBI, was decreasing during the entire period. Nevertheless, MSNBC shows three peaks: one in 2013, another in 2015, and the last one in 2021.
There can be an argument that national networks do not report on petty crimes and prefer bigger stories. Therefore, violent crime might be more telling. On MSNBC, crime reporting started to increase in 2011 and peaked in 2013. Even considering that there might be a lag in reporting, so it spills into the following year also, this peak does not resemble FBI data. FBI violent crime actually increased between 2014 and 2016, even though on MSNBC, street crime reporting decreased considerably after 2015.
After 2018, the story might differ. FBI underreported crime in 2021, so there might be a peak. Similarly, crime reporting on MSNBC reached pinacle in 2021. Nevertheless, the increase in crime reporting on MSNBC was gradual and started already in 2017. So, it seems that it preceded the FBI statistics.
The second category consists of news about President Trump. A rapid increase in this category can be seen after the 2016 election. The first peak consists of the investigation into Russian meddling in the 2016 U.S. election and related content about investigations into the Trump Organization and the hush money case. This category is, for the most part, not related to street crime and surpasses street crime–related content frequency by about one-fifth.
The next two categories are related to the Republican Party. Republican Crime contains convictions or accusations of Republican Party members, except for President Trump. This category closely mirrors the trend in coverage of President Trump, as many investigations targeted both the president and party members (e.g., the Mueller investigation). Another political category concerns policies or politics related to the Republican Party. For the most part, this category contains critiques of conservative policies, combined with internal Republican partisan politics. While this category has always been important, it received particularly strong attention during President Trump’s presidency. It is difficult to determine whether these categories reflect genuine trends. However, it is unlikely that Republican Party members were involved in substantially more wrongdoing in the years after 2016 than in earlier periods.
The following categories are related to street-level crime. The first focuses on discrimination against Black Americans. This category contains either highly publicized cases related to discrimination (Ferguson, the George Floyd murder) or explicit commentary about discrimination. This category peaked in 2015 (mostly Ferguson) and in 2021 (mostly George Floyd). The majority of cases in this category are related to police discrimination. It is hard to know whether this category follows an underlying trend, as such data are not readily available. It seems that police shootings by race were quite stable since 2017, so it is also likely that the 2021 peak was driven more by a strongly publicized cases than by a higher incidence of this type of crime.
The Abuse category contains any mentions of women or child abuse in crime news. For abuse against women, there was a peak in 2018, which is partially reflected in the transcripts. Child abuse was relatively stable between 2012 and 2018 and has been decreasing since (although this decrease is probably less pronounced because the number of children has also declined). The child abuse trend is even less revealing. The highest peak in this category appears to be driven primarily by the Sandusky case and discussions of sexual abuse in the military.
The topic of gun reform and gun restrictions peaked around 2013. It was unlikely driven by gun murders, but may be more related to the increase in mass shooting victims in 2012.
Lastly, after 2020, the narrative began to be substantially populated by news about the January 6 Capitol attack.
What is the overlap of these stories in actual street-level crime?
The goal of my project was to identify crime stories that might affect individual behavior, so I had to expand on the previous results, as they do not tell the full story. Political crime stories do not meaningfully affect how people perceive crime in their own neighborhoods and are unlikely to directly influence local economic activity or migration patterns. Therefore, I examined what proportion of overall street-level crime news consisted of these topics.
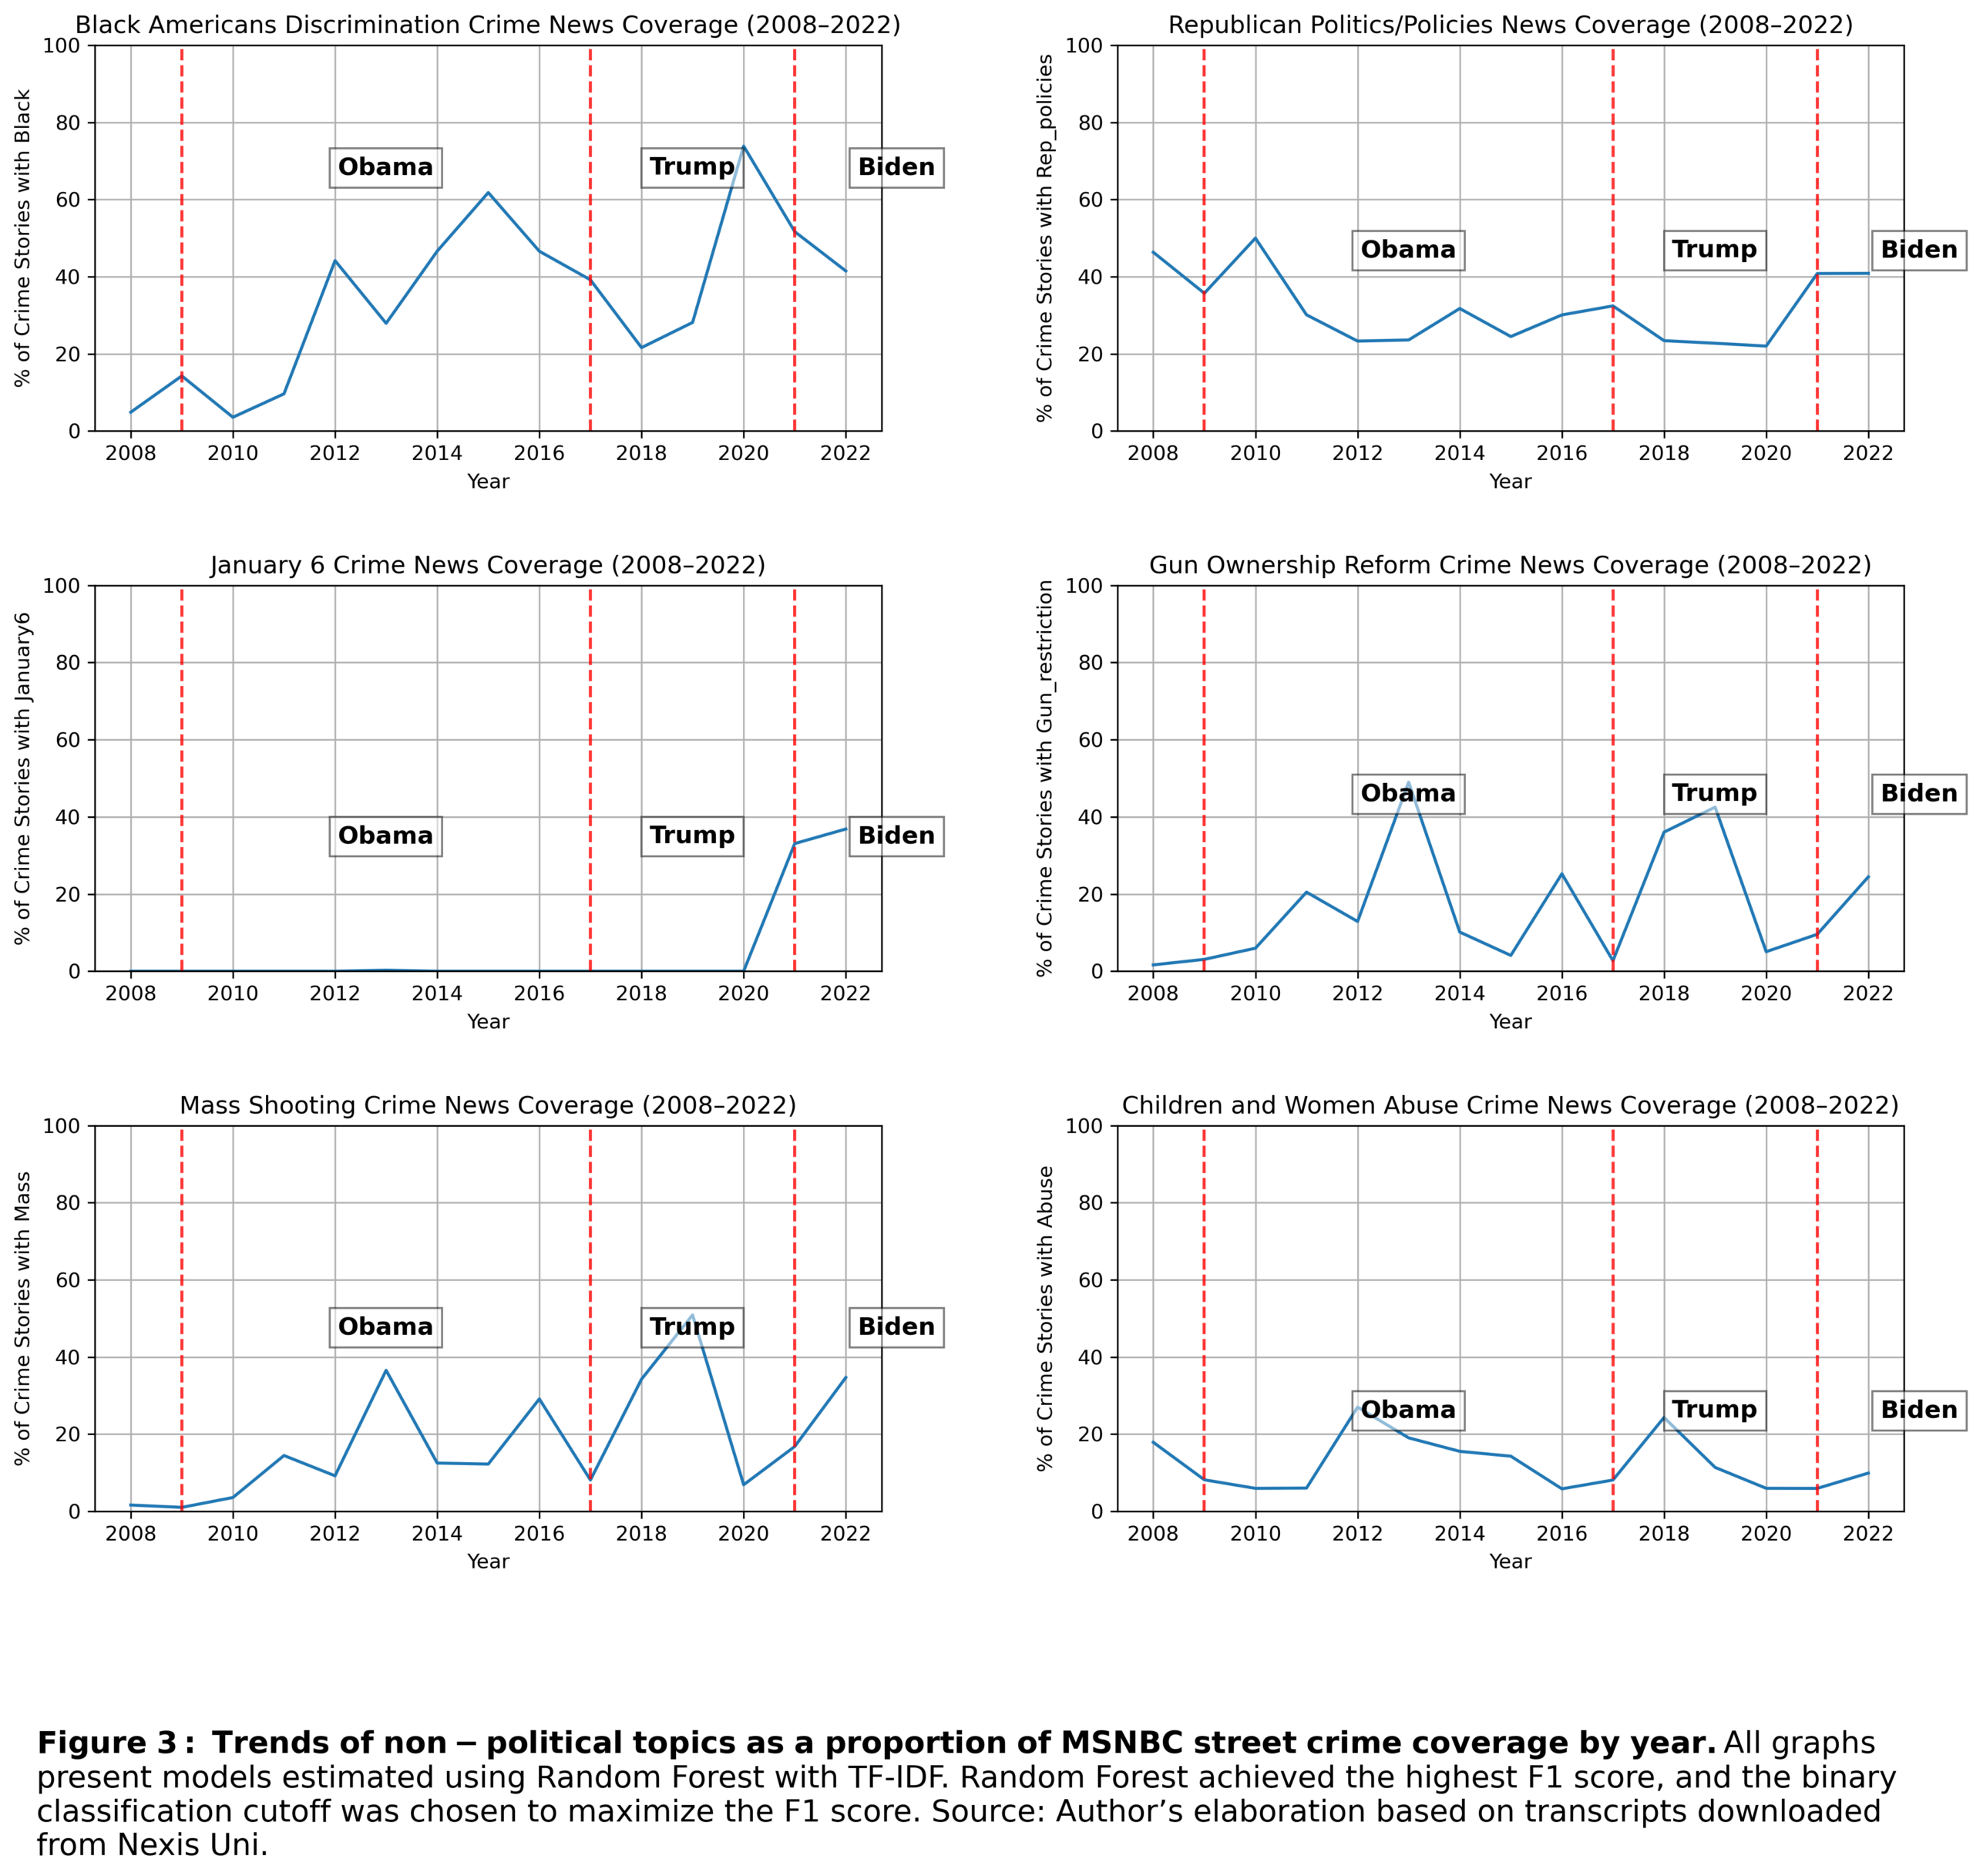
Street crime stories about discrimination against Black Americans constitute the most prevalent category. Peaks are maintained, as at some points over 60% of street crime stories also contain an aspect of discrimination. That strongly supports the impression from the earlier graphs that overall crime coverage is substantially driven by this category.
Crime reports containing Republican politics or policies are also quite prevalent. Their share remains relatively stable over time, fluctuating between 20% and 40%. However, it is considerably less prevalent than in the previous section, indicating that much of this category is not tied to street-level crime itself.
The debate about the January 6 Capitol attack increased its presence considerably. Approaching 40% might not sound like a lot, but considering that this is a single event, as opposed to the other categories, it is quite a substantial number.
The gun reform category lost its earlier peak. That might indicate that the first peak was inflated mostly by political news rather than tangible crimes. Now it is quite closely tied to mass shooting stories, which naturally relate to this topic. Mass shooting stories, on the other hand, are more aligned with their actual statistics (and show a trend very similar to what I had on Fox News, for that matter).
The abuse category now has the lowest peaks, around 20%. The first peak likely relates to child abuse (Sandusky case), and the second peak likely relates to 2018 (around the peak of the Me Too movement).
What if I exclude politics from crime reporting?
The obvious question, and the one I also asked during my analysis of Fox News, is how crime would appear without politics. I use two definitions. Under the first, I exclude news about Trump, Republican Crime, and Republican Politics/Policies; under the second, I keep Republican Politics/Policies in the data. Both definitions are valid, as Republican Politics/Policies might actually contain legitimate crimes with political commentary.
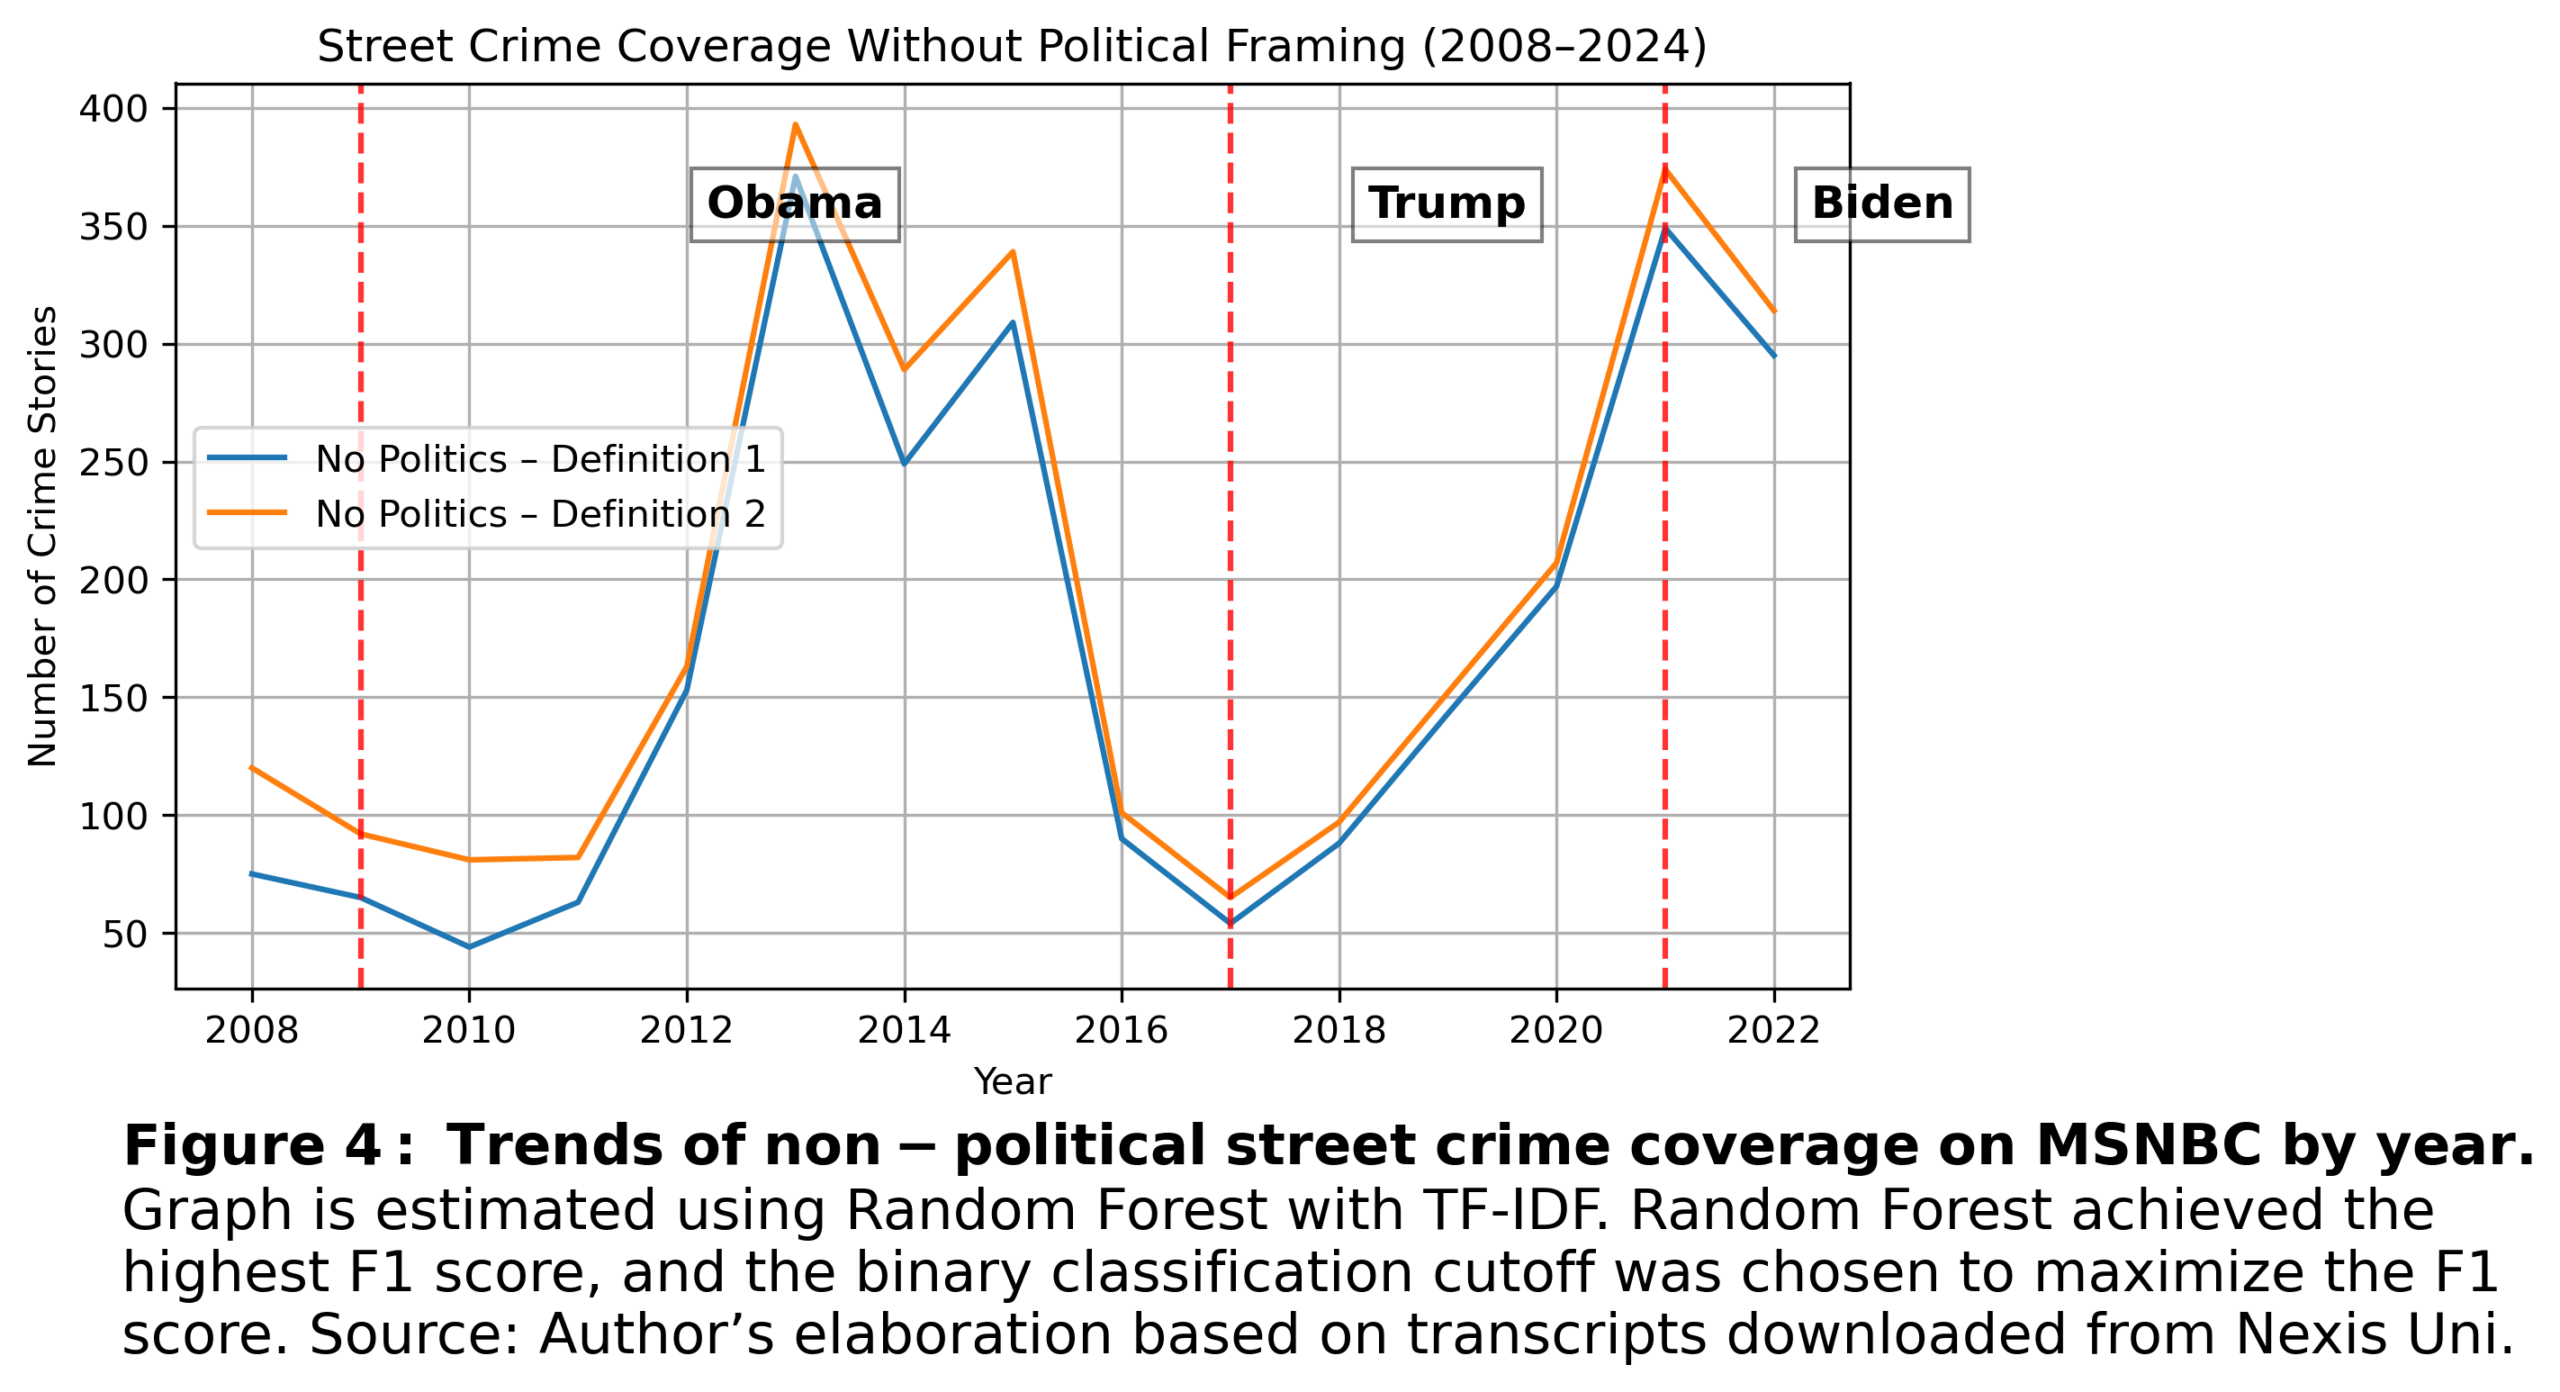
Unsurprisingly, they are nearly identical, as most of the commentary about conservative policies does not contain any mention of actual crimes. Even now, the patterns in FBI statistics and the transcripts do not match. The peak in FBI violent crime in 2016 occurred after the transcript peak. Additionally, FBI statistics decreased between 2016 and 2019, which is the opposite of what the transcripts show. The 2021 peak might be legitimate only if FBI crime reporting was not underreported.
So, is crime reporting proportional to reality?
Well… not really! Crime coverage appears to be driven mainly by a few specific categories of crime. Moreover, even within these categories, it does not seem to track underlying trends but is instead amplified by singular, highly publicized events.